
Academic English > Descriptive reports
There are a number of different writing styles. For academic purposes, we can define two broad categories opinion-based essays and descriptive reports. With regard to descriptive reports, here are the types of things you are likely, at some point, to have to describe:
People & Places
Diagrams
Graphs
Tables
…
People & Places
Descriptive essays provide explanations about something or someone. They typically include summaries, explanations and examples based upon source materials.
People
Places
The Silk Road
The frankincense trade
The coffee trade
The Panama Canal
The Hanging Gardens
Hagia Sophia
Abbasid era innovations
&c. (et cetera)
The Bank of England
The Gold Standard
BlackBerry: the fall of a trendsetting giant
Nokia: a Viking no more
Robotics (AI)
Telecommuting
Migrant labour
…
Top | People & Places | Diagrams | Graphs | Tables
…
Diagrams
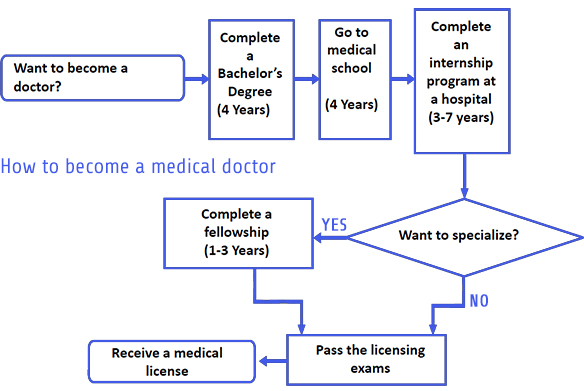
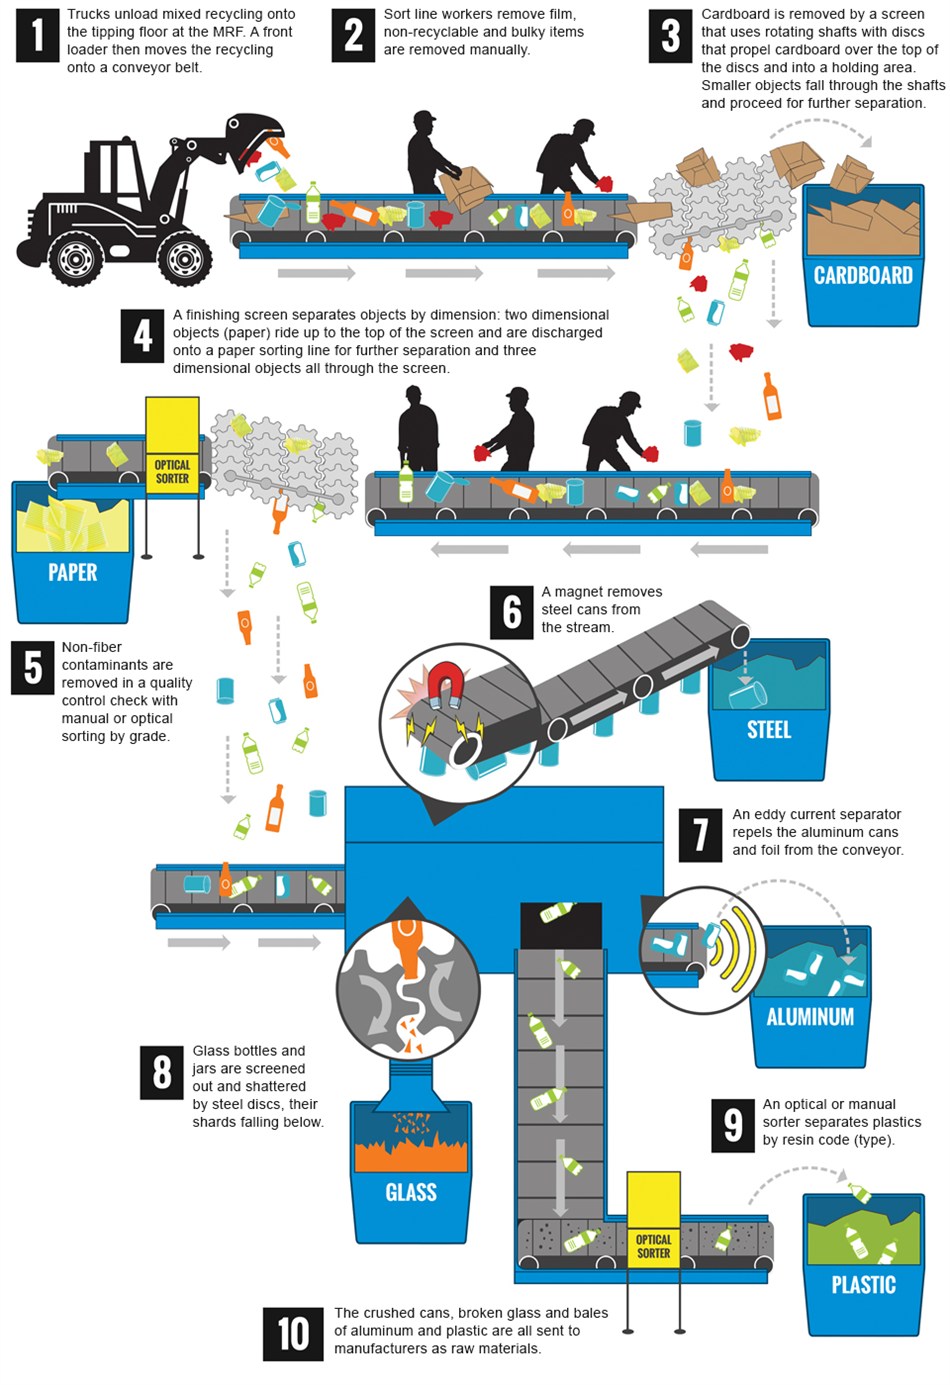
Sometimes we need to describe the steps (“stages”) of a process. Diagrams and flowcharts are often used to illustrate processes.
| Some useful vocabulary | |||
| كلمات للاستخدام بين خطوات (أو مراحل) في عملية | |||
| Step/s | الخطوات | The flowchart shows the steps people take to become… | |
| Stage/s | المراحل | The flowchart shows the stages from KG to UAEU… | |
| First | أولا | The first step in the process is to… | |
| Secondly | ثانيا | Secondly you need to turn on the kettle… | |
| Then | ثم | Then you have to open the fridge… | |
| Next | التالي | Next you have to do some work experience… | |
| After that | بعد ذلك | After that you must take the IELTS exam… | |
| Finally | أخيرا | Finally you can drink your coffee… | |
| Lastly | في الختام | Lastly you get your driving licence… | |
| لوصف خيار | |||
| If … then | إذا … إذن | If people get 5.0 then they… | |
| لوصف عدد من الخطوات (أو مراحل) في عملية | |||
| Several | بعض | There are several steps in this process… | |
| Few | قليل | There are a few stages in this process… | |
| Lots | الكثير من | There are lots of steps in the process of making Harees… | |
Prepare
Organisation: How to structure a report describing a flowchart
Vocabulary: How to describe processes shown in flowcharts
Practice
Process: How to get from high school to university
Process: How to get a driving licence
Process: How to get free eggs!
Maps
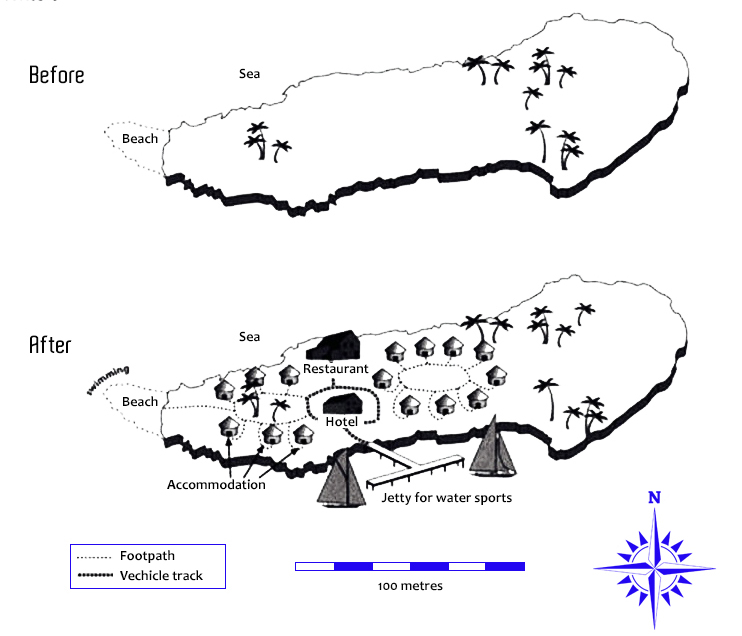
Maps 01: Tropical island, before and after development
With maps like the one below, you will need to compare between the two periods (time-frames). In this case “prior to development” and “after development”. It is important to realise that you do not need to describe every change, focus (a) on the overall change and (b) describe the key changes (differences) and the ways things have stayed the same (similarities). As is always the case with Task 1 reports, the skill here is to focus on key distinctions and notable similarities.
Comprehension questions Submit your report
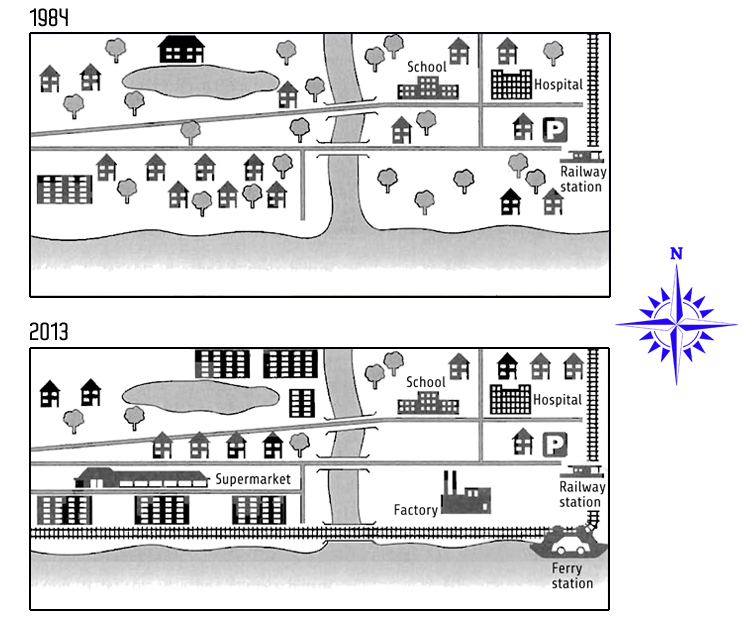
Maps 02: Millwall Town
With maps like the one below, you will need to compare between the two periods (time-frames). In this case 1984 and 2013. It is important to realise that you do not need to describe every change, focus (a) on the overall change (is it minor, major or total?) and (b) describe the key changes (differences) and the ways things have stayed the same (similarities).As is always the case with Task 1 reports, the skill here is to focus on key distinctions and notable similarities.
Comprehension questions Submit your report
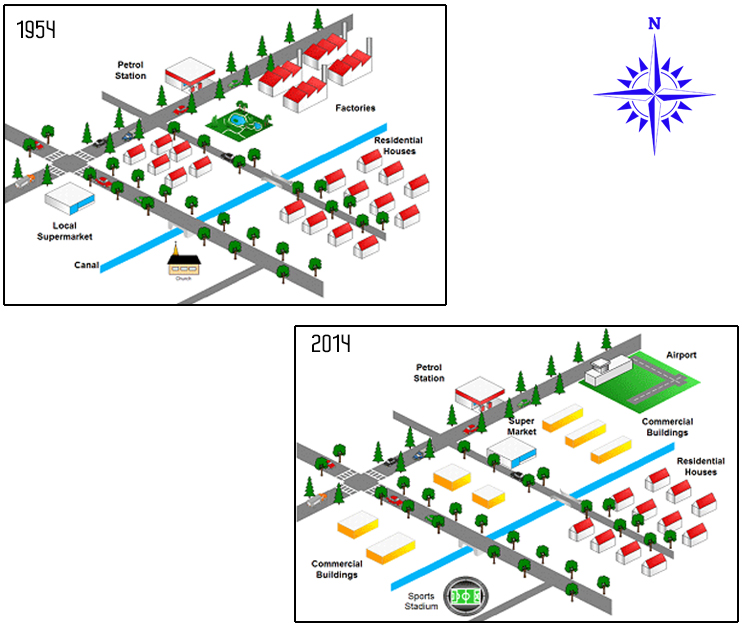
Maps 03: Trenchtown, half a century on
With maps like the one below, you will need to compare between the two time-frames. It is important to realise that you do not need to describe every change, focus (a) on the overall change (is it minor, major or total?) and (b) describe the key changes (differences) and the ways things have stayed the same (similarities). As is always the case with Task 1 reports, the skill here is to focus on key distinctions and notable similarities.
Comprehension questions Submit your report
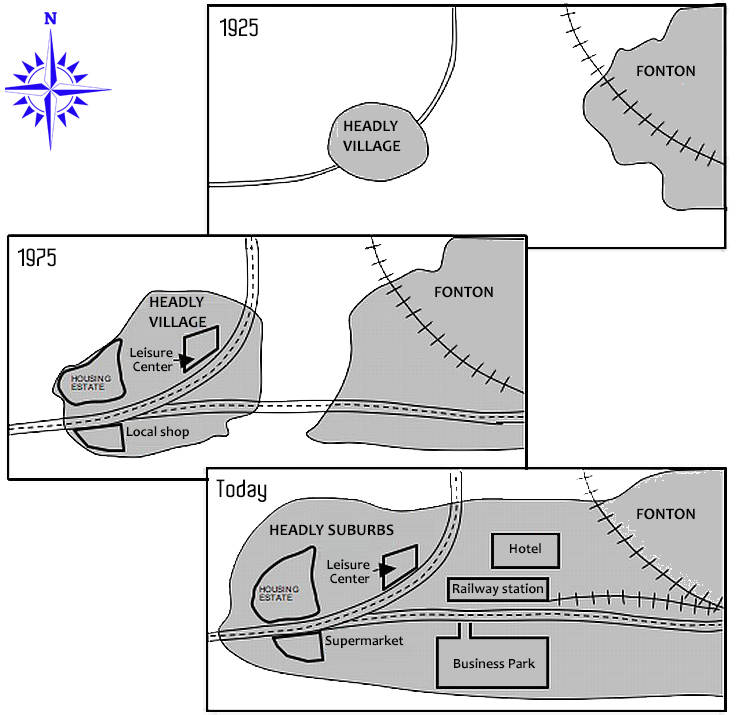
Maps 04: Fonton
With maps like the one below, you will need to compare between (a) the beginning and the end of the period and (b) between each of the periods. Focus on the overall changes and describe the key differences and also, the things that have stayed the same or similar. As is always the case with Task 1 reports, the skill here is to focus on key distinctions and notable similarities.
Comprehension questions Submit your report
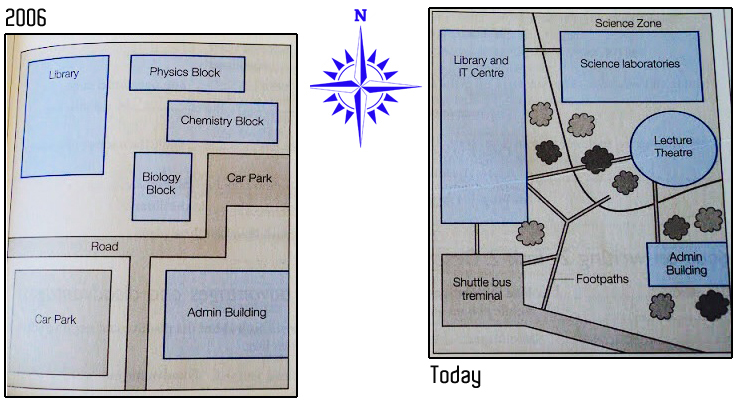
Map 05: The upgrading of Hull University
With maps like the one below, you will need to compare between the two stages of development: before the upgrade and after the upgrade. Focus on the overall changes and describe the key differences. Are there any ways in which this university campus has remained the same or similar?
Comprehension questions Submit your report
Top | People & Places | Diagrams | Graphs | Tables
…
Graphs
==============================
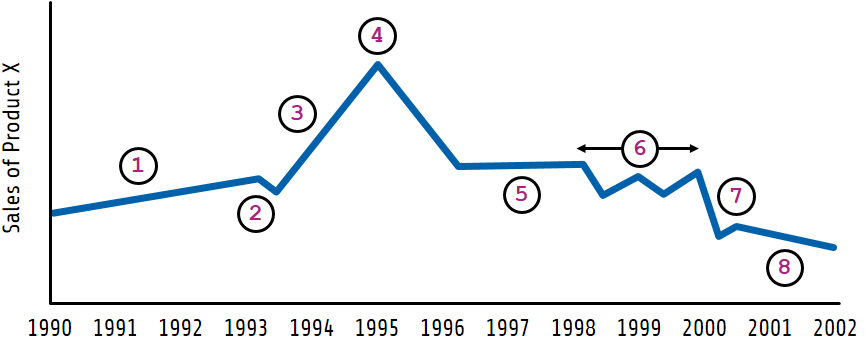
Line graphs are often used to describe change over a period of time. For example, the number of products sold each year between 1990 and 2002 (“Sales of Product X”):
Comprehension questions
Line Graph 1 Line Graph 2 Model report
The line represents a set of data (numbers or percentages) and often, graphs have several lines:

If the line in the graph is going “up” think (and write) increase:
Sales were increasing between YYYY and YYYY.
There was an increase in sales from MM to MM.
If the line in the graph is going “down” think (and write) decrease:
Sales were decreasing during YYYY.
There was a decrease in sales during the period MM to MM.
.
Grammar
For each change/movement there are a number of verbs and nouns to express the movement:
Use a verb of change, for example: Unemployment levels fell
Or a related noun, for example: There was a fall in unemployment levels
A good description will also provide additional details:
There has been a slight increase in the value of the dollar (degree of change)
Unemployment fell rapidly last year (speed of change)
Remember:
Nouns are modified with adjectives (dramatic rise)
Verbs are modified with an adverb (rose dramatically).
Adjective + Noun
There was a dramatic rise in iPad sales.
There was a sharp increase in the number of chocolate bars eaten.
There was a slow decrease in the number of visitors to Al Ain Zoo.
Verb + Adverb
The number of iPads sold rose dramatically.
The number of chocolate bars eaten increased sharply.
The number of visitors to Al Ain Zoo decreased slowly.
.
Vocabulary
Line graphs are often used to illustrate change over time. The time-frame or period of time can be e.g. hours; days; months; years or decades. For instance, a line graph might be used to show how the population of a country has changed during a 25 year time period.
Normally, when you describe the overall trend you would write about the difference from the beginning (start) of the graph to the end of the graph.
For example:
Overall, we can see that there was an increase in sales, between the years 1999 and 2009.
Overall, between January and April, the graph shows there was a decrease in the number of cars sold.
| Word | Syllables | Translation &c. |
| Increase | in·crease | زيادة [verb] Noun: in·crease To become or make greater in size, amount, or degree. — There has been an increase in obesity since 2003. |
| Upward | up·ward | إلى فوق [verb] Noun: rise To become or make greater in size, amount, or degree. — There has been a rise in obesity since 2003. Verb: rise To move from a lower position to a higher one; to go up. — Local people are worried by the rise in crime during the summer holidays. |
| Decrease | de·crease | انخفاض [verb] Noun: decrease To become or make greater in size, amount, or degree. — There has been a rise in obesity since 2003. Verb: rise To move from a lower position to a higher one; to go up. — Local people are worried by the rise in crime during the summer holidays. |
| Downward | down·ward | الى أسفل [verb] Noun: downward To become or make greater in size, amount, or degree. — There has been a rise in obesity since 2003. Verb: rise To move from a lower position to a higher one; to go up. — Local people are worried by the rise in crime during the summer holidays. |
| Peak | peak | قمة [verb] Adjective: peak To become or make greater in size, amount, or degree. — There has been a rise in obesity since 2003. Verb: rise To move from a lower position to a higher one; to go up. — Local people are worried by the rise in crime during the summer holidays. |
| Fluctuate | fluc·tu·ate | تذبذب [verb] Noun: fluctuation Something that rises and falls irregularly in number or amount. — Trade with other countries tends to fluctuate from year to year. |
Degree of change
When describing a line graph, it is important to identify big changes and also small changes:
| Adjectives | Adverbs | |
| Dramatic | Dramatically | (big) There was |
| Sharp | Sharply | (big) There was a sharp rise in sales. —In 1996, sales rose sharply. |
| Steep | Steeply | (big) There was |
| Substantial | Substantially | (big) There was |
| Significant | Significantly | (big) There was |
| Noticeable | Noticeably | (big) There was |
| Marginal | Marginally | (small) There was |
| Minimal | Minimally | (small) There was |
Other useful vocabulary includes: highest point/lowest point; stayed the same/no change.
Speed of change
Another important thing to do when describing a line graph is to say if the speed of change is fast or slow:
| Adjectives | Adverbs | |
| Rapid | Rapidly | (fast) There was a rapid increase in sales before the Eid holidays. – Sales decreased rapidly between September and November. |
| Quick | Quickly | (fast) There was a quick rise in sales. – Sales rose quickly |
| Sudden | Suddenly | (fast) There was a sudden fall in sales – Sales fell suddenly |
| Steady | Steadily | (slow) There was a steady decrease in sales – Sales decreased steadily during the winter months. |
| Gradual | Gradually | (slow) There was a gradual decrease in sales in 1999. – Sales decreased gradually during the summer period. |
Vocabulary in use
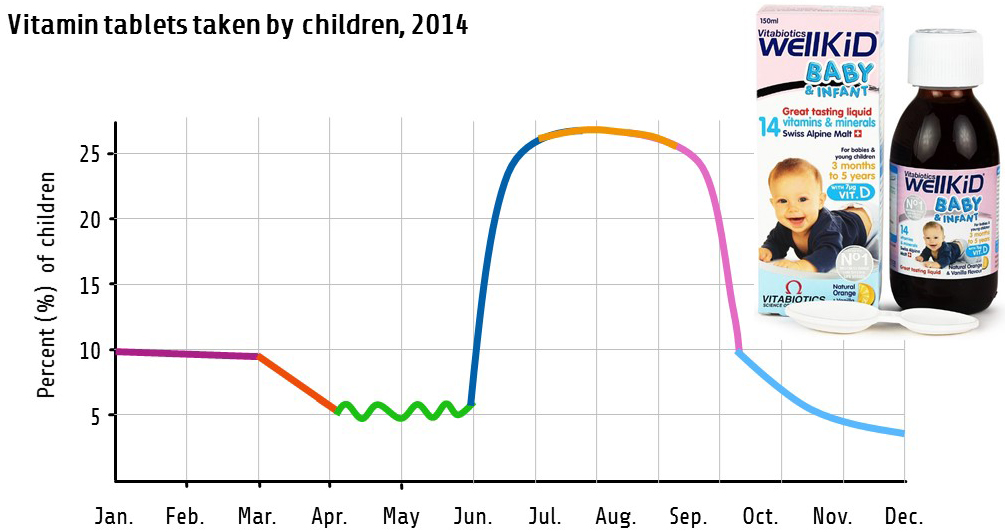
| remain (-ed) unchanged, steady, stable, constant, fixed, static “stayed the same,” “did not change” From January to March the percentage of children using supplements remained static. |
|
| fall (fell, fallen), decrease (-ed), drop (-ed), plunge (-ed), decline (-ed) slight (-ly), steady (-ly), gradual (-ly), gentle (gently), slow (-ly), “a downward trend” It then fell gradually in March. |
|
| fluctuate (-ed), fluctuation
The percentage fluctuated for the following two months. |
|
| rise (rose, risen), grow (grew, grown), climb (-ed, -ed), shoot up (shot up, shot up) dramatic (dramatically), sharp (sharply), significant (significantly), rapid (rapidly) upward trend There was a significant increase in the percentage of children taking vitamins June and August. |
|
| peak (-ed), reach (-ed, -ed)
The percentage of children taking dietary supplements was at its highest |
|
| fall (fell, fallen), decrease (-ed), drop (-ed) dramatic (dramatically), sharp (sharply), significant (significantly), rapid (rapidly) Between August and October, this figure dropped dramatically to 11%. |
|
| Between October and December, the decrease in the use of dietary supplements was much slower than in the previous two months. Supplement use continued to fall steadily over the next two months until it reached its lowest point in December. It fell to a low of only 5% in December. |
|
.
Practice 01: Describing data shown in line graphs
Describing data shown in line graphs
| Graph A |
In 1970, the number of cars . . . . . . . . . . . . . . . . . . . . . . . . . . . five. After that, the number . . . . . . . . . . . . . . . . . . . . . . . . . . . 50 in 1990. Finally, it . . . . . . . . . . . . . . . . . . . . . . . . . . . 40 in 2000. |
|
| Graph B |
In 1970, the number of cars . . . . . . . . . . . . . . 20. Then, from 1970 to 1980, it . . . . . . . . . . . . . . 40. In 1990, the number of cars . . . . . . . . . . . . . . 30. After that, in 2000, the number . . . . . . . . . . . . . . back to 40. |
|
| Graph C |
In 1970, the number of cars . . . . . . . . . . . . . . 60. From 1970 to 2000, there was a . . . . . . . . . . . . . . ten. |
|
| Graph D |
The number of cars . . . . . . . . . . . . . . 20 in 1970. Then, there was an . . . . . . . . . . . . . . . . . . . . . . . . . . . . 50 in 1990. From 1990 to 2000, the number of cars . . . . . . . . . . . . . . 50 to 40. |
|
| Graph E |
The number of cars . . . . . . . . . . . . . . 10 in 1970. From 1970 to 1980, it . . . . . . . . . . . . . . and . . . . . . . . . . . . . . 60 in 1990. In 2000, the number of cars . . . . . . . . . . . . . . 30. |
|
| Graph F |
In 1970, the number of cars . . . . . . . . . . . . . . 40. The number . . . . . . . . . . . . . . 60 between 1980 and 1990. Finally, the number in 2000 . . . . . . . . . . . . . . 20. |
|
| Graph G |
The number of cars . . . . . . . . . . . . . . 60 in 1970. Then, there was a . . . . . . . . . . . . . . in the number of cars to 40 in 1980. This figure . . . . . . . . . . . . . . 40 for the next 20 years. |
|
| Graph H |
The number of cars . . . . . . . . . . . . . . ten in 1970. Then, from 1980, it . . . . . . . . . . . . . . for the next 10 years at 30. It then . . . . . . . . . . . . . . 60 in 2000. |
|
.
Practice 02: Grammar (Verbs to Nouns)
Re-write the sentences below, changing the verbs to nouns.
For example:
Numbers rise sharply from 6 to 8 am. There is a sharp rise in numbers from 6 to 8 am
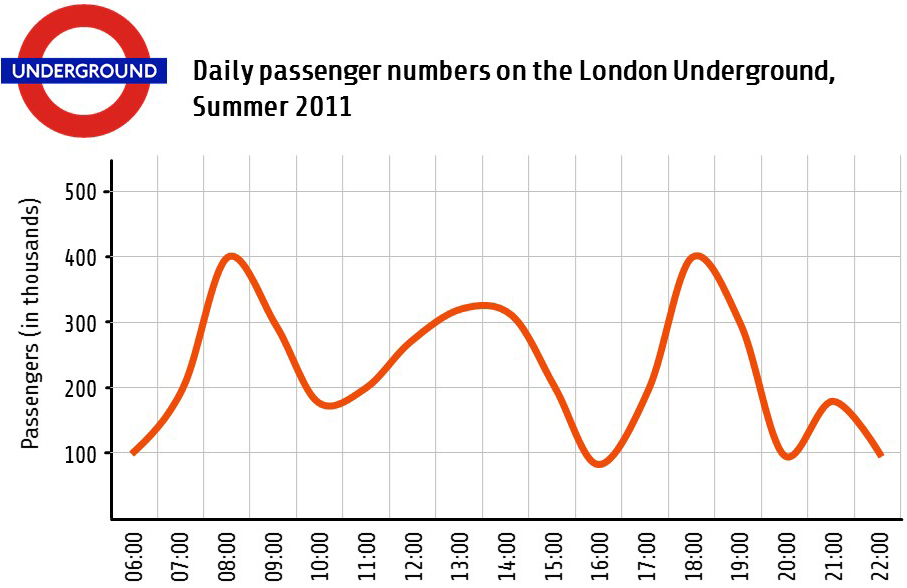
1. At 8 in the morning, passenger numbers peak at about 400.
2. In the next two hours, figures fall sharply to under 200.
3. Next, numbers rise slightly in the afternoon.
4. In the late afternoon, numbers fall rapidly, reaching a low of approximately 100.
5. Numbers increase in the next two hours, peaking at around 400.
6. Between 6 and 10 pm, figures fluctuate greatly.
7. From 6 to 8 in the evening, numbers drop dramatically.
8. The number of passengers decreases significantly from 6 to 8 pm.
9. Finally, numbers rise and fall marginally in the last couple hours.
10. Last, the number of commuters increases and decreases slightly in the final two hours.
.
Practice 03: Example line graphs
Overview: Describing overall trends and gap-fill tasks
Describing data shown in line graphs
Gap-fill tasks – Line graphs to show “Oil production in Canada”
Line graph: The numbers of fish caught in North America

Practice
Pie charts [Survey on what makes people happy]
Pie charts [Proved oil reserves]
Top | People & Places | Diagrams | Graphs | Tables
…
Tables
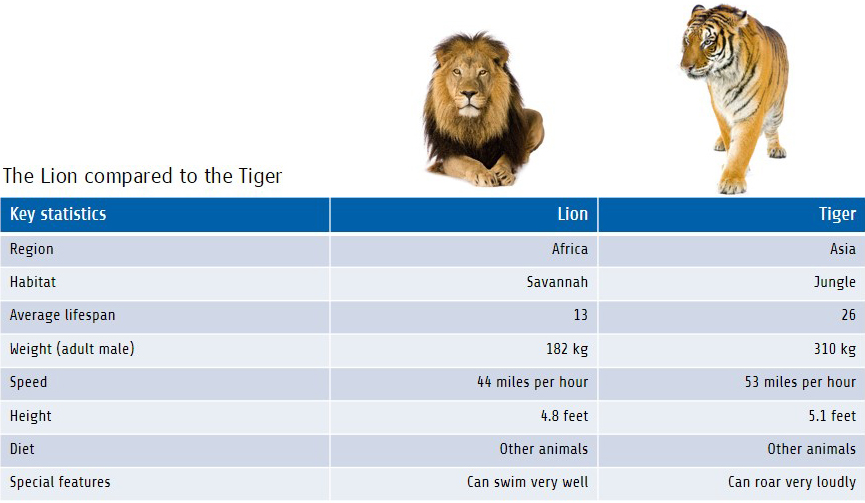
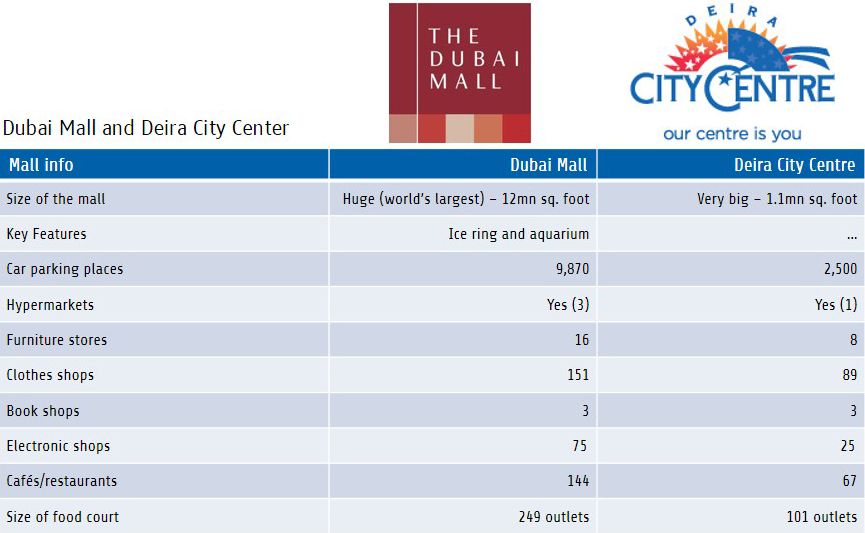
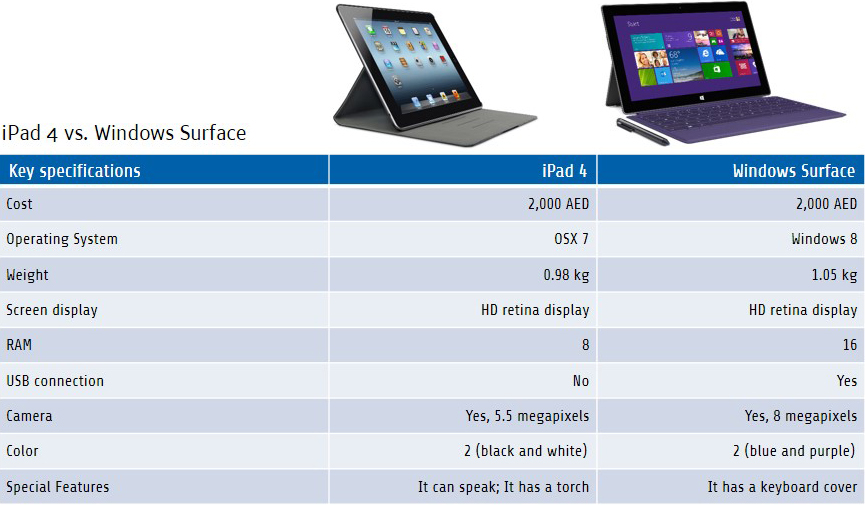
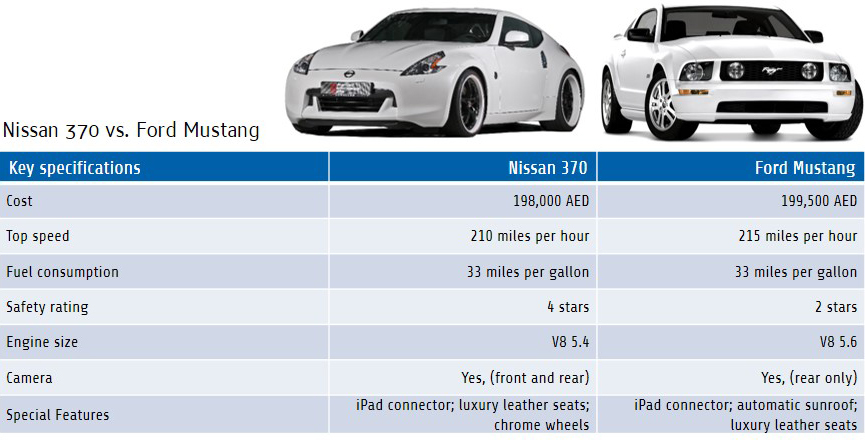
When describing “information” (“facts and figures” “data”) provided in a table, you will need to write about the similarities and differences between the things being compared. There are a number of ways to do this. However, one of the most common is to use comparative and superlative adjectives.
Adjectives
Comparative and superlative adjectives
For example, when describing the table below you would compare and contrast (the similarities and differences) between horses and camels:

A good descriptive report will have a minimum of three paragraphs: an introduction, one paragraph that describes the differences and one paragraph that describes the similarities and the ways in which the things being compared are exactly the same.
How to describe information shown in Tables
“Compare & Contrast” reports
“Compare & Contrast” reports
Comparing and contrasting facts and figures
Practice
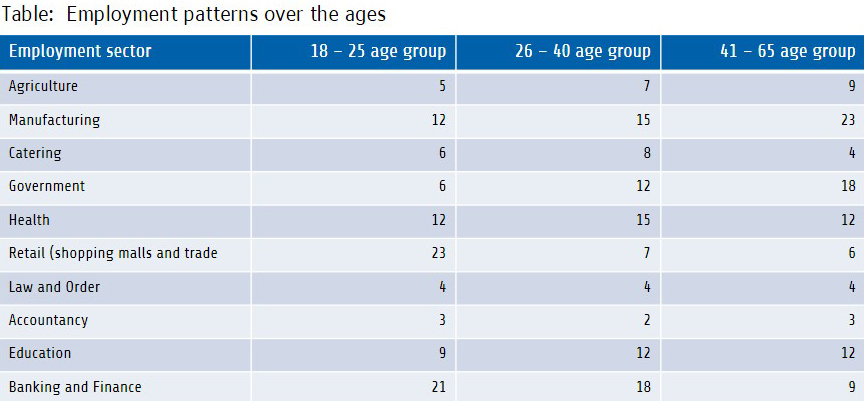
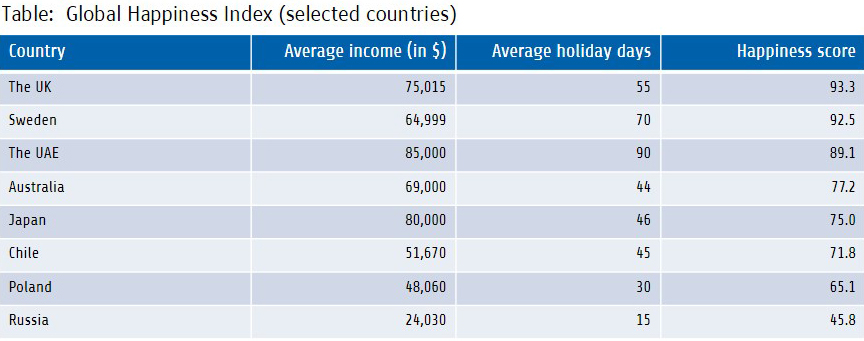
With tables like the one below, you will need to compare between the age groups and also between the different employment sectors of the economy.
With tables like the one below, you will need to compare between countries and also consumption and production figures. It is important to realise also that you should not describe all of the details. The task (skill) here is to focus on the key distinctions and notable similarities.
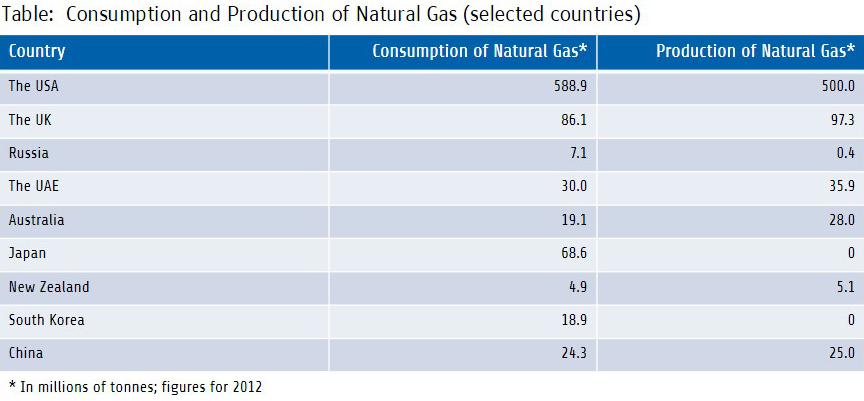
With tables like the one below, you will need to compare between countries and also consumption and production figures. It is important to realise also that you should not describe all of the details. The task (skill) here is to focus on key distinctions and notable similarities.


Compare/contrast: Emirates and Etihad
Compare/contrast: the Nissan Patrol and the Toyota Landcruiser
Compare/contrast: Du and Etisalat
Compare/contrast: London and Oslo
Compare/contrast: Doha and Kuwait city
Emirates and Etihad compared
Top | People & Places | Diagrams | Graphs | Tables