
WritingReport practiceEssay practiceReading practiceFormattingGrammarVocabulary
Model Report
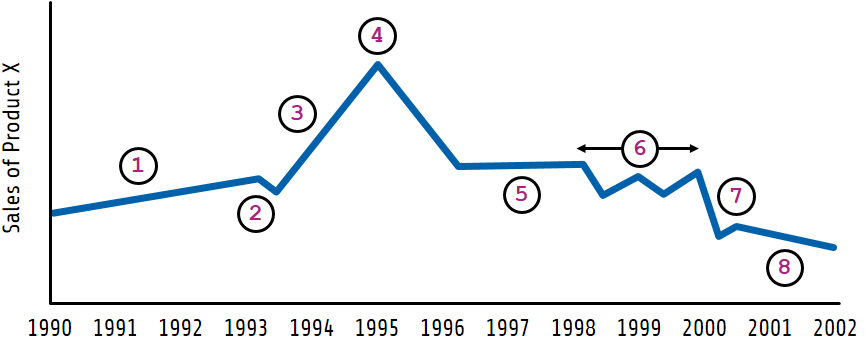
The line graph shows the changes in sales of Product X between 1990 and 2002. In this report I will describe the key movements. Overall, the sales of Product X changed quite a lot but between from 1990 to 2002 there was a small decrease.
First of all, between 1990 and 1993 sales increased steadily. Then in 1993 there was a small drop in sales. After that, from 1994 to 1995 sales increased sharply. We can see that sales peaked in 1995. However, after that they decreased rapidly. From 1996 to around 1998, sales of Product X did not change (they stayed the same). During the period from 1998 to 2000 there was a fluctuation in sales. Finally, from approximately the year 2000 onward sales of Product X decreased.
word count: 129