
Resources > Images & Infographics
Graphics (from Greek γραφικός “graphikos”)
Graphics include all visual presentations that are projected onto a surface of some form (inter alia, a wall; a canvas; a sheet of paper; electronic screens), their purpose is to brand, entertain or illustrate. “Graphs” — be they bar graphs, line graphs or pie graphs — depict data (i.e., facts and figures in a spreadsheet) in a graphical, more visually stimulating, form.


CONCEPTS EXPLAINED (animation & audio)


EPHEMERA [ ɪˈfɛm(ə)rə ]


![]()


![]()
Figure 1. Cost of Living
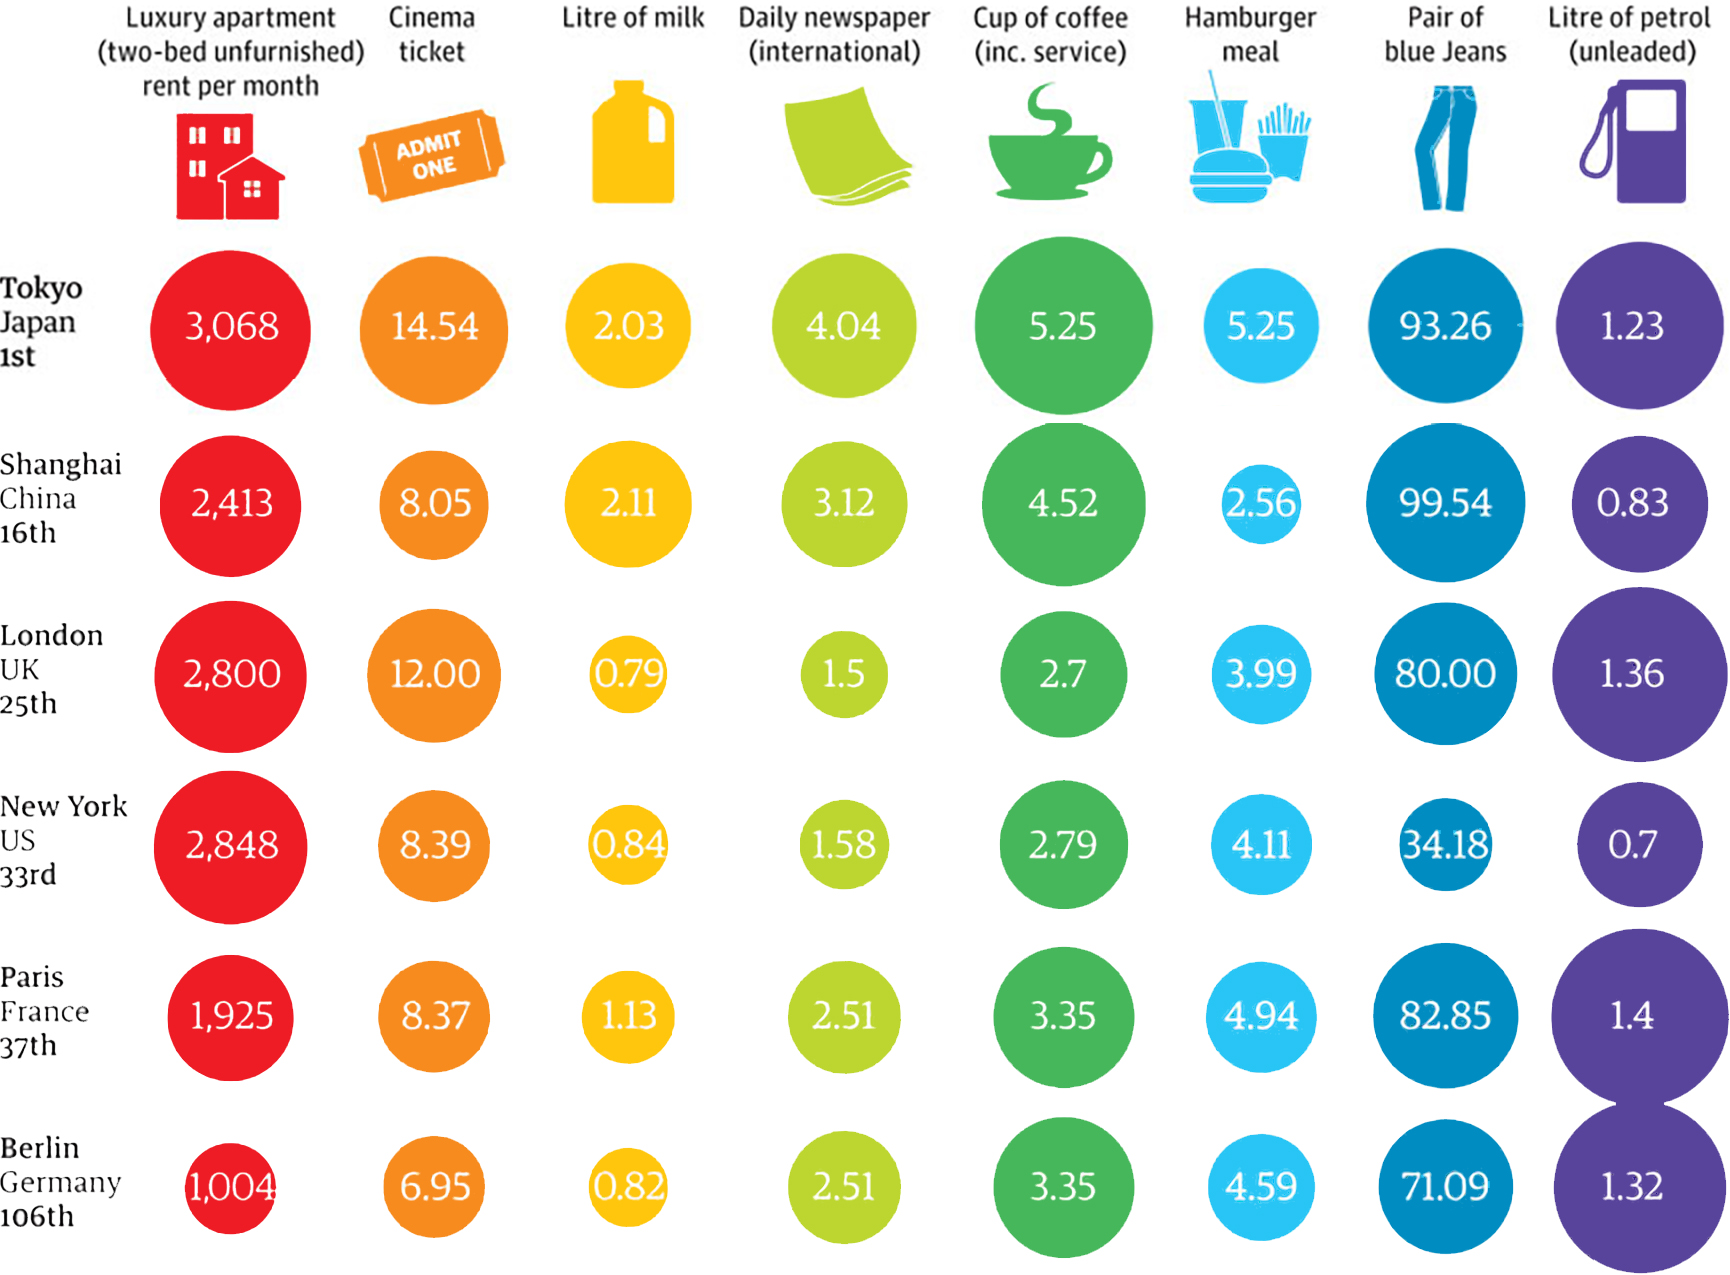
Notes: The figures are in UK Pounds Sterling (GBP; £).
Source: The Guardian (2012). Which is the world’s most expensive city?
Figure 2. Movement of Labour
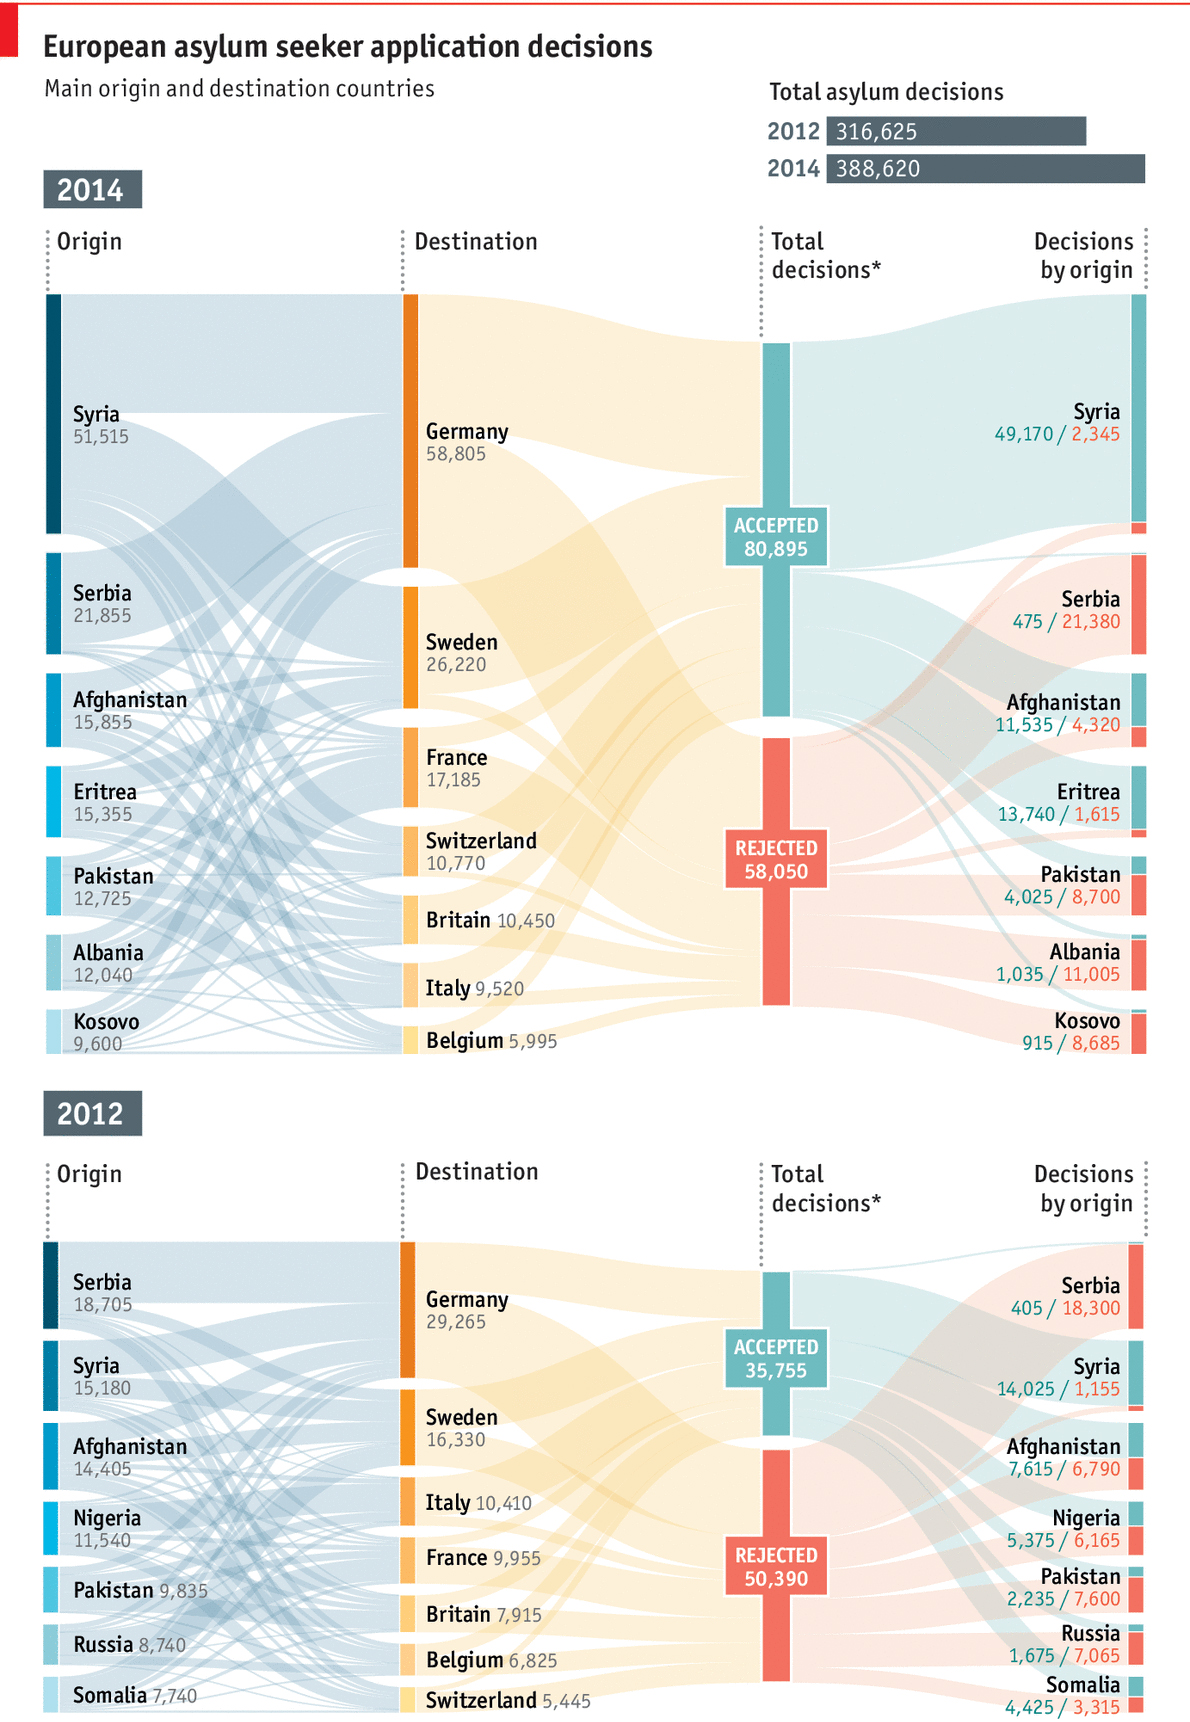
Source: The Economist (2015). Seeking Safety.

BBC Radio 4: PHILOSOPHY ARCHIVE (audio)

BBC Radio 4: SCIENCE ARCHIVE (audio)