
WritingReport practiceEssay practiceReading practiceFormattingGrammarVocabulary
How many things are being compared?
What is being compared and in how many ways?
What is the unit of measure?
Which year is this data for?
In which two countries is production the highest?
Which two countries have the lowest consumption rates?
Which countries have similar consumption levels?
Which country’s consumption/production levels the most similar?
What adjectives will you use?
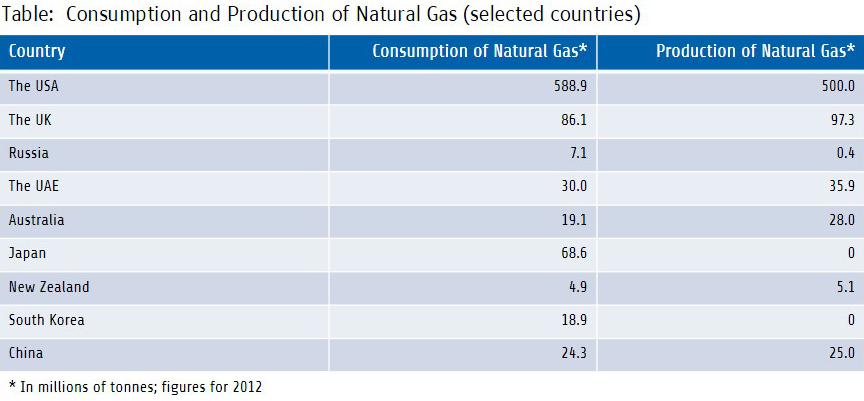
The table provides some facts and figures about two tablets the consuption of Natural Gas and production of natural gas.In this report I shall compare and contrast between them. Overall it seems that the differences are greater than the similarities. (six compared to three).
To begin with I will focus on the differences between two latest tablets. First the USA consumption of gas 588.9 it is more than the UK that consumption 86.1, moreover the production the USA also more than The UK ( 500.0 comperd 97.3). Second Russia is less than Australia in consumption and production. Russia consumption 7.1 and production 0.4. However, Australia consumption 19.1 and production 28.0. Also we have a big different between Japan and South Korea. Japan consumption of gas 68.6 However South Korea 18.9. Moreover japan production 0 and South Korea exactly the same.
Now I will describe the ways in which the two tablets are similar and also exactly the same. We have three country I will compared about these of how they consumption and production of gas. The UAE consumption 30.0 it is more than New Zealand and China however New Zealand 4.9 and china 24.3. Also the UAE production of gas more than two countries the UAE production 35.9 however New Zealand 5.1 and china 25.0